Verify Network
This section goes into depth on how SD-Core (which runs inside the Kubernetes cluster) connects to either physical gNBs or an emulated RAN (both running outside the Kubernetes cluster). It also describes how to run diagnostics to debug potential problems.
For the purpose of this section, we assume you already have a scalable cluster running (as outlined in the previous section), SD-Core has been installed on that cluster, and you have a terminal window open on the Master node in that cluster.
Network Schematic
Figure 5 shows a high-level schematic of
Aether's end-to-end User Plane connectivity, where we start by
focusing on the basics: a single Aether node, a single physical gNB,
and just the UPF container running inside SD-Core. The identifiers
shown in gray in the figure (10.76.28.187, 10.76.28.113,
ens18) are taken from our running example of an actual
deployment (meaning your details will be different). All the other
names and addresses are part of a standard Aether configuration.
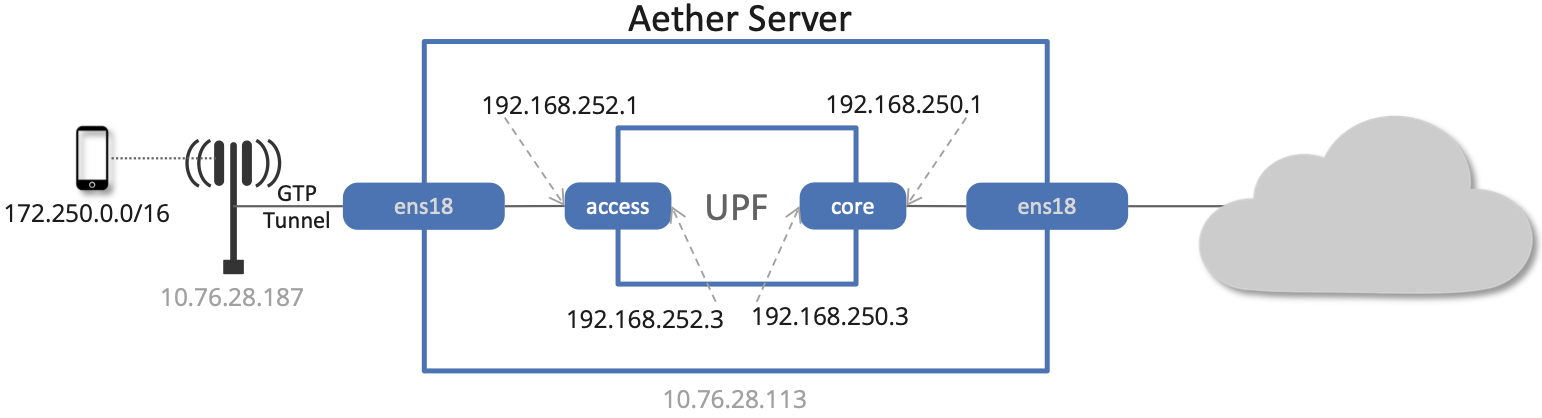
Figure 5. The UPF pod running inside the server hosting Aether, with
core and access bridging the two. Identifiers
10.76.28.187, 10.76.28.113, ens18 are specific to
a particular deployment site.
As shown in the figure, there are two bridges that connect the
physical interface (ens18 in our example) with the UPF
container. The access bridge connects the UPF downstream to the
RAN (this corresponds to 3GPP's N3 interface) and is assigned IP subnet
192.168.252.0/24. The core bridge connects the UPF upstream
to the Internet (this corresponds to 3GPP's N6 interface) and is assigned
IP subnet 192.168.250.0/24. This means, for example, that the
access interface inside the UPF (which is assigned address
192.168.252.3) is the destination IP address of GTP-encapsulated
user plane packets from the gNB.
Following this basic schematic, it is possible to verify that the UPF
is connected to the network by checking to see that the core and
access are properly configured. This can be done using ip, and
you should see results similar to the following:
$ ip addr show core
15: core@ens3: <BROADCAST,MULTICAST,UP,LOWER_UP> mtu 1500 qdisc noqueue state UP group default qlen 1000
    link/ether 06:f7:7c:65:31:fc brd ff:ff:ff:ff:ff:ff
    inet 192.168.250.1/24 brd 192.168.250.255 scope global core
       valid_lft forever preferred_lft forever
    inet6 fe80::4f7:7cff:fe65:31fc/64 scope link
       valid_lft forever preferred_lft forever

$ ip addr show access
14: access@ens3: <BROADCAST,MULTICAST,UP,LOWER_UP> mtu 1500 qdisc noqueue state UP group default qlen 1000
    link/ether 82:ef:d3:bb:d3:74 brd ff:ff:ff:ff:ff:ff
    inet 192.168.252.1/24 brd 192.168.252.255 scope global access
       valid_lft forever preferred_lft forever
    inet6 fe80::80ef:d3ff:febb:d374/64 scope link
       valid_lft forever preferred_lft forever
The above output from ip shows the two interfaces visible to the
server, but running outside the container. kubectl can be used
to see what's running inside the UPF, where bessd is the name of
the container image that implements the UPF, and access and
core are the last two interfaces shown below:
$ kubectl -n aether-5gc exec -ti upf-0 bessd -- ip addr
1: lo: <LOOPBACK,UP,LOWER_UP> mtu 65536 qdisc noqueue state UNKNOWN group default qlen 1000
    link/loopback 00:00:00:00:00:00 brd 00:00:00:00:00:00
    inet 127.0.0.1/8 scope host lo
    valid_lft forever preferred_lft forever
    inet6 ::1/128 scope host
    valid_lft forever preferred_lft forever
3: eth0@if30: <BROADCAST,MULTICAST,UP,LOWER_UP> mtu 1450 qdisc noqueue state UP group default
    link/ether 8a:e2:64:10:4e:be brd ff:ff:ff:ff:ff:ff link-netnsid 0
    inet 192.168.84.19/32 scope global eth0
    valid_lft forever preferred_lft forever
    inet6 fe80::88e2:64ff:fe10:4ebe/64 scope link
    valid_lft forever preferred_lft forever
4: access@if2: <BROADCAST,MULTICAST,UP,LOWER_UP> mtu 1500 qdisc noqueue state UP group default
    link/ether 82:b4:ea:00:50:3e brd ff:ff:ff:ff:ff:ff link-netnsid 0
    inet 192.168.252.3/24 brd 192.168.252.255 scope global access
    valid_lft forever preferred_lft forever
    inet6 fe80::80b4:eaff:fe00:503e/64 scope link
    valid_lft forever preferred_lft forever
5: core@if2: <BROADCAST,MULTICAST,UP,LOWER_UP> mtu 1500 qdisc noqueue state UP group default
    link/ether 4e:ac:69:31:a3:88 brd ff:ff:ff:ff:ff:ff link-netnsid 0
    inet 192.168.250.3/24 brd 192.168.250.255 scope global core
    valid_lft forever preferred_lft forever
    inet6 fe80::4cac:69ff:fe31:a388/64 scope link
    valid_lft forever preferred_lft forever
When packets flowing upstream from the gNB arrive on the server's
physical interface, they need to be forwarded over the access
interface. This is done by having the following kernel route
installed, which should be the case if your Aether installation was
successful:
$ ip ro|grep "dev access"
192.168.252.0/24 dev access proto kernel scope link src 192.168.252.1
Within the UPF, the correct behavior is to forward packets between the
access and core interfaces. Upstream packets arriving on the
access interface have their GTP headers removed and the raw IP
packets are forwarded to the core interface. The routes inside
the UPF's bessd container will look something like this:
$ kubectl -n aether-5gc exec -ti upf-0 -c bessd -- ip route
default via 169.254.1.1 dev eth0
default via 192.168.250.1 dev core metric 110
10.76.28.0/24 via 192.168.252.1 dev access
10.76.28.113 via 169.254.1.1 dev eth0
169.254.1.1 dev eth0 scope link
192.168.250.0/24 dev core proto kernel scope link src 192.168.250.3
192.168.252.0/24 dev access proto kernel scope link src 192.168.252.3
The default route via 192.168.250.1 directs upstream packets to
the Internet via the core interface, with a next hop of the
core interface outside the UPF. These packets then undergo source
NAT in the kernel and are sent to the IP destination in the packet.
This means that the 192.168.100.0/24 addresses assigned to UEs are
not visible beyond the Aether server. The return (downstream) packets
undergo reverse NAT and now have a destination IP address of the UE.
They are forwarded by the kernel to the core interface by these
rules on the server:
$ ip ro |grep "dev core"
192.168.100.0/24 via 192.168.250.3 dev core proto static
192.168.250.0/24 dev core proto kernel scope link src 192.168.250.1
The first rule above matches packets to the UEs on the
192.168.100.0/24 subnet. The next hop for these packets is the
core IP address inside the UPF. The second rule says that next
hop address is reachable on the core interface outside the UPF.
As a result, the downstream packets arrive in the UPF where they are
GTP-encapsulated with the IP address of the gNB.
Note that if you are not finding access and core interfaces
outside the UPF, the following commands can be used to create these
two interfaces manually (again using our running example for the
physical ethernet interface):
$ ip link add core link ens18 type macvlan mode bridge 192.168.250.3
$ ip link add access link ens18 type macvlan mode bridge 192.168.252.3
Beyond this basic understanding, there are three other details of
note. First, we have been focusing on the User Plane because Control
Plane connectivity is much simpler: RAN elements (whether they are
physical gNBs or gNBsim) reach the AMF using the server's actual IP
address (10.76.28.113 in our running example). Kubernetes is
configured to forward SCTP packets arriving on port 38412 to the
AMF container.
Second, the basic end-to-end schematic shown in Figure 5 assumes each gNB is assigned an address on the same L2
network as the Aether cluster (e.g., 10.76.28.0/24 in our example
scenario). This works when the gNB is physical or when we want to run
a single gNBsim traffic source, but once we scale up the gNBsim by
co-locating multiple containers on a single server, we need to
introduce another network so each container has a unique IP address
(even though the containers are all hosted on the same node). This more
complex configuration is depicted in Figure 6,
where 172.20.0.0/16 is the IP subnet for the virtual network (also
implemented by a Macvlan bridge, and named gnbaccess).
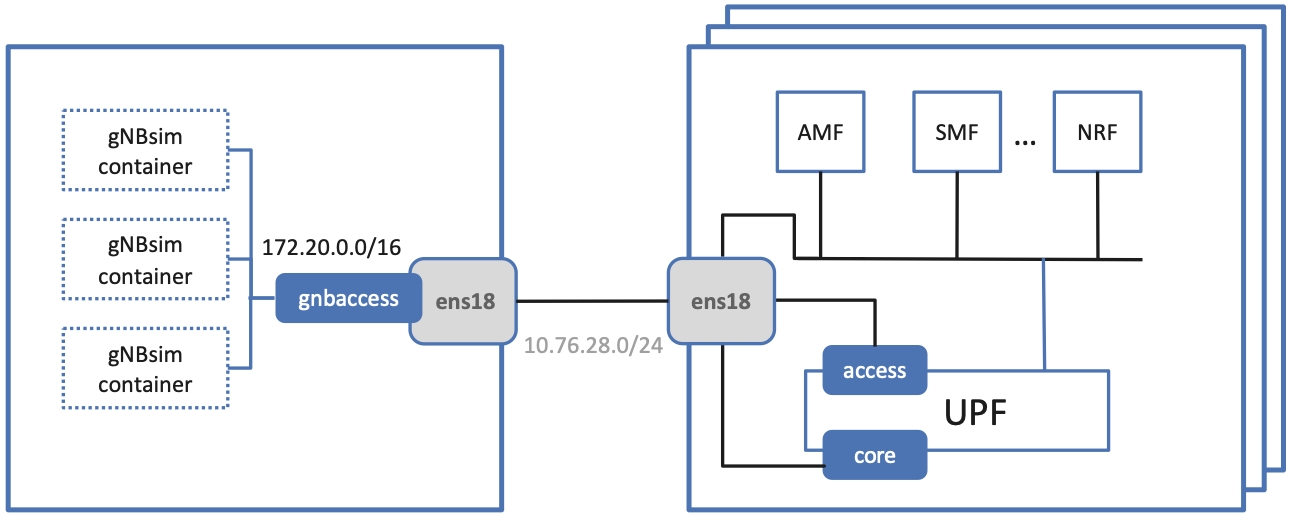
Figure 6. A server running multiple instances of gNBsim, connected to Aether.
For completeness, Figure 7 shows the Macvlan
setup for the Quick Start configuration, where both the gnbaccess
bridge and gNBsim container run in the same server as the Core (but
with the container manged by Docker, independent of Kubernetes).
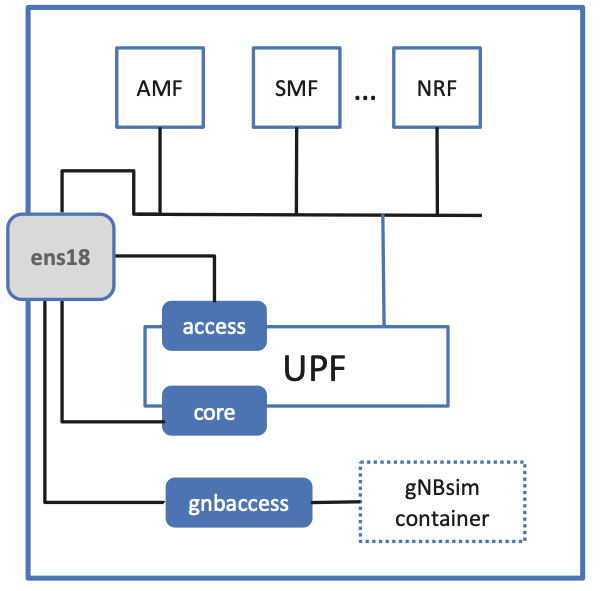
Figure 7. The Quick Start configuration with all components running in a single server.
Finally, all of the configurable parameters used throughout this
section are defined in the core and gnbsim sections of the
vars/main.yml file. Note that an empty value for
core.ran_subnet implies the physical L2 network is used to connect
RAN elements to the core, as is typically the case when connecting
physical gNBs. Many of the other variables are explained in subsequent
sections, but for a summary, see the Quick Reference.
core:
    standalone: true                                # set to false to place under control of ROC
    data_iface: ens18
    values_file: "deps/5gc/roles/core/templates/sdcore-5g-values.yaml"
    ran_subnet: "172.20.0.0/16"             # set to empty string to get subnet from 'data_iface'
    helm:
        local_charts: false                 # set chart_ref to local path name if true
        chart_ref: aether/sd-core
        chart_version: 1.1.0
    upf:
        ip_prefix: "192.168.252.0/24"
        iface: "access"
        mode: af_packet                             # Options: af_packet or dpdk
        default_upf:
            ip:
                access: "192.168.252.3/24"
                core:   "192.168.250.3/24"
            ue_ip_pool: "192.168.100.0/24"
    amf:
        ip: "10.76.28.113"

gnbsim:
    ...
    router:
        data_iface: ens18
        macvlan:
            iface: gnbaccess
            subnet_prefix: "172.20"
Packet Traces
Successfully connecting a UE to the Internet involves configuring the UE, gNB, and SD-Core software in a consistent way; establishing SCTP-based control plane (N2) and GTP-based user plane (N3) connections between the base station and Mobile Core; and traversing multiple IP subnets along the end-to-end path.
Packet traces are the best way to diagnose your deployment, and the
most helpful traces you can capture are shown in the following
commands. You can run these on the Aether server, where we use our
example ens18 interface for illustrative purposes:
$ sudo tcpdump -i any sctp -w sctp-test.pcap
$ sudo tcpdump -i ens18 port 2152 -w n3-outside.pcap
$ sudo tcpdump -i access port 2152 -w n3-inside.pcap
$ sudo tcpdump -i core net 192.168.100.0/24 -w n6-inside.pcap
$ sudo tcpdump -i ens18 net 192.168.100.0/24 -w n6-outside.pcap
The first trace, saved in file sctp.pcap, captures SCTP packets
sent to establish the control path between the base station and the
Mobile Core (over the N2 interface). Toggling "Mobile Data" on a
physical UE, for example by turning Airplane Mode off and on, will
generate the relevant control plane traffic; gNBsim automatically
triggers this activity.
The second and third traces, saved in files n3-outside.pcap and
n3-inside.pcap, respectively, capture GTP packets (tunneled
through port 2152 ) on the RAN side of the UPF. Setting the
interface to ens18 corresponds to "outside" the UPF and setting
the interface to access corresponds to "inside" the UPF. Running
ping from a physical UE will generate the relevant user plane traffic
(over the N3 interface); gNBsim automatically triggers this activity.
Similarly, the fourth and fifth traces, saved in files
n6-inside.pcap and n6-outside.pcap, respectively, capture IP
packets on the Internet side of the UPF (over the N6 interface).
In these two tests, net 192.168.100.0/24 corresponds to the IP
addresses assigned to UEs by the SMF. Running ping from a physical
UE will generate the relevant user plane traffic; gNBsim automatically
triggers this activity.
If the n3-outside.pcap has packets and the n3-inside.pcap
is empty (no packets captured), you may run the following commands
to make sure packets are forwarded from the ens18 interface
to the access interface and vice versa:
$ sudo iptables -A FORWARD -i ens18 -o access -j ACCEPT
$ sudo iptables -A FORWARD -i access -o ens18 -j ACCEPT