Closer Look
Before tearing down your Quick Start deployment, there are three additional steps you can take to watch Aether in action. The first is to bring up the Aether Management Plane (AMP), which includes Dashboards showing different aspects of Aether's runtime behavior. The second is to inspect the logs written by the various microservices. The third is to enable packet capture, and then run an analysis tool to trace the flow of packets into and out of SD-Core.
Install AMP
The Aether Management Platform (AMP) is implemented by two Kubernetes applications: Runtime Operational Control (ROC) and a Monitoring Service.[1] AMP can be deployed on the same cluster as SD-Core by executing the following Make target:
$ make aether-amp-install
Once complete, kubectl will show the aether-roc and
cattle-monitoring-system namespaces running in support of these
two services, respectively, plus new atomix pods in the
kube-system namespace. Atomix is the scalable key-value store
that keeps the ROC data model persistent.
You can access the dashboards for the two subsystems, respectively, at
http://<server_ip>:31194
http://<server_ip>:30950
The programmatic API underlying the Control Dashboard, which was
introduced in Section 6.4, can
be accessed at http://10.76.28.113:31194/aether-roc-api/ in our
example deployment (where Aether runs on host 10.76.28.113). Note
that if you visit that URL from a browser, OpenAPI will show you
example GET, DELETE, and POST requests. Those examples assume the
prefix http://10.76.28.113:31194/aether-roc-api/ (not just
http://10.76.28.113:31194), so for example, to GET the resource
corresponding to site-1, you would need to use the following URL:
http://10.76.28.113:31194/aether-roc-api/aether/v2.1.x/the-enterprise/site/site-1
There is much more to say about the ROC and the Aether API, which we
return to in the Runtime Control section. For
now, we suggest you simply peruse the Control Dashboard by starting
with the dropdown menu in the upper right corner. For example,
selecting Devices will show the set of UEs registered with Aether,
similar to the screenshot in Figure 2. In an
operational setting, these values would be entered into the ROC
through either the GUI or the underlying API. For the Quick Start
scenario we're limiting ourselves to in this section, these values are
loaded from deps/amp/5g-roc/templates/roc-5g-models.json.
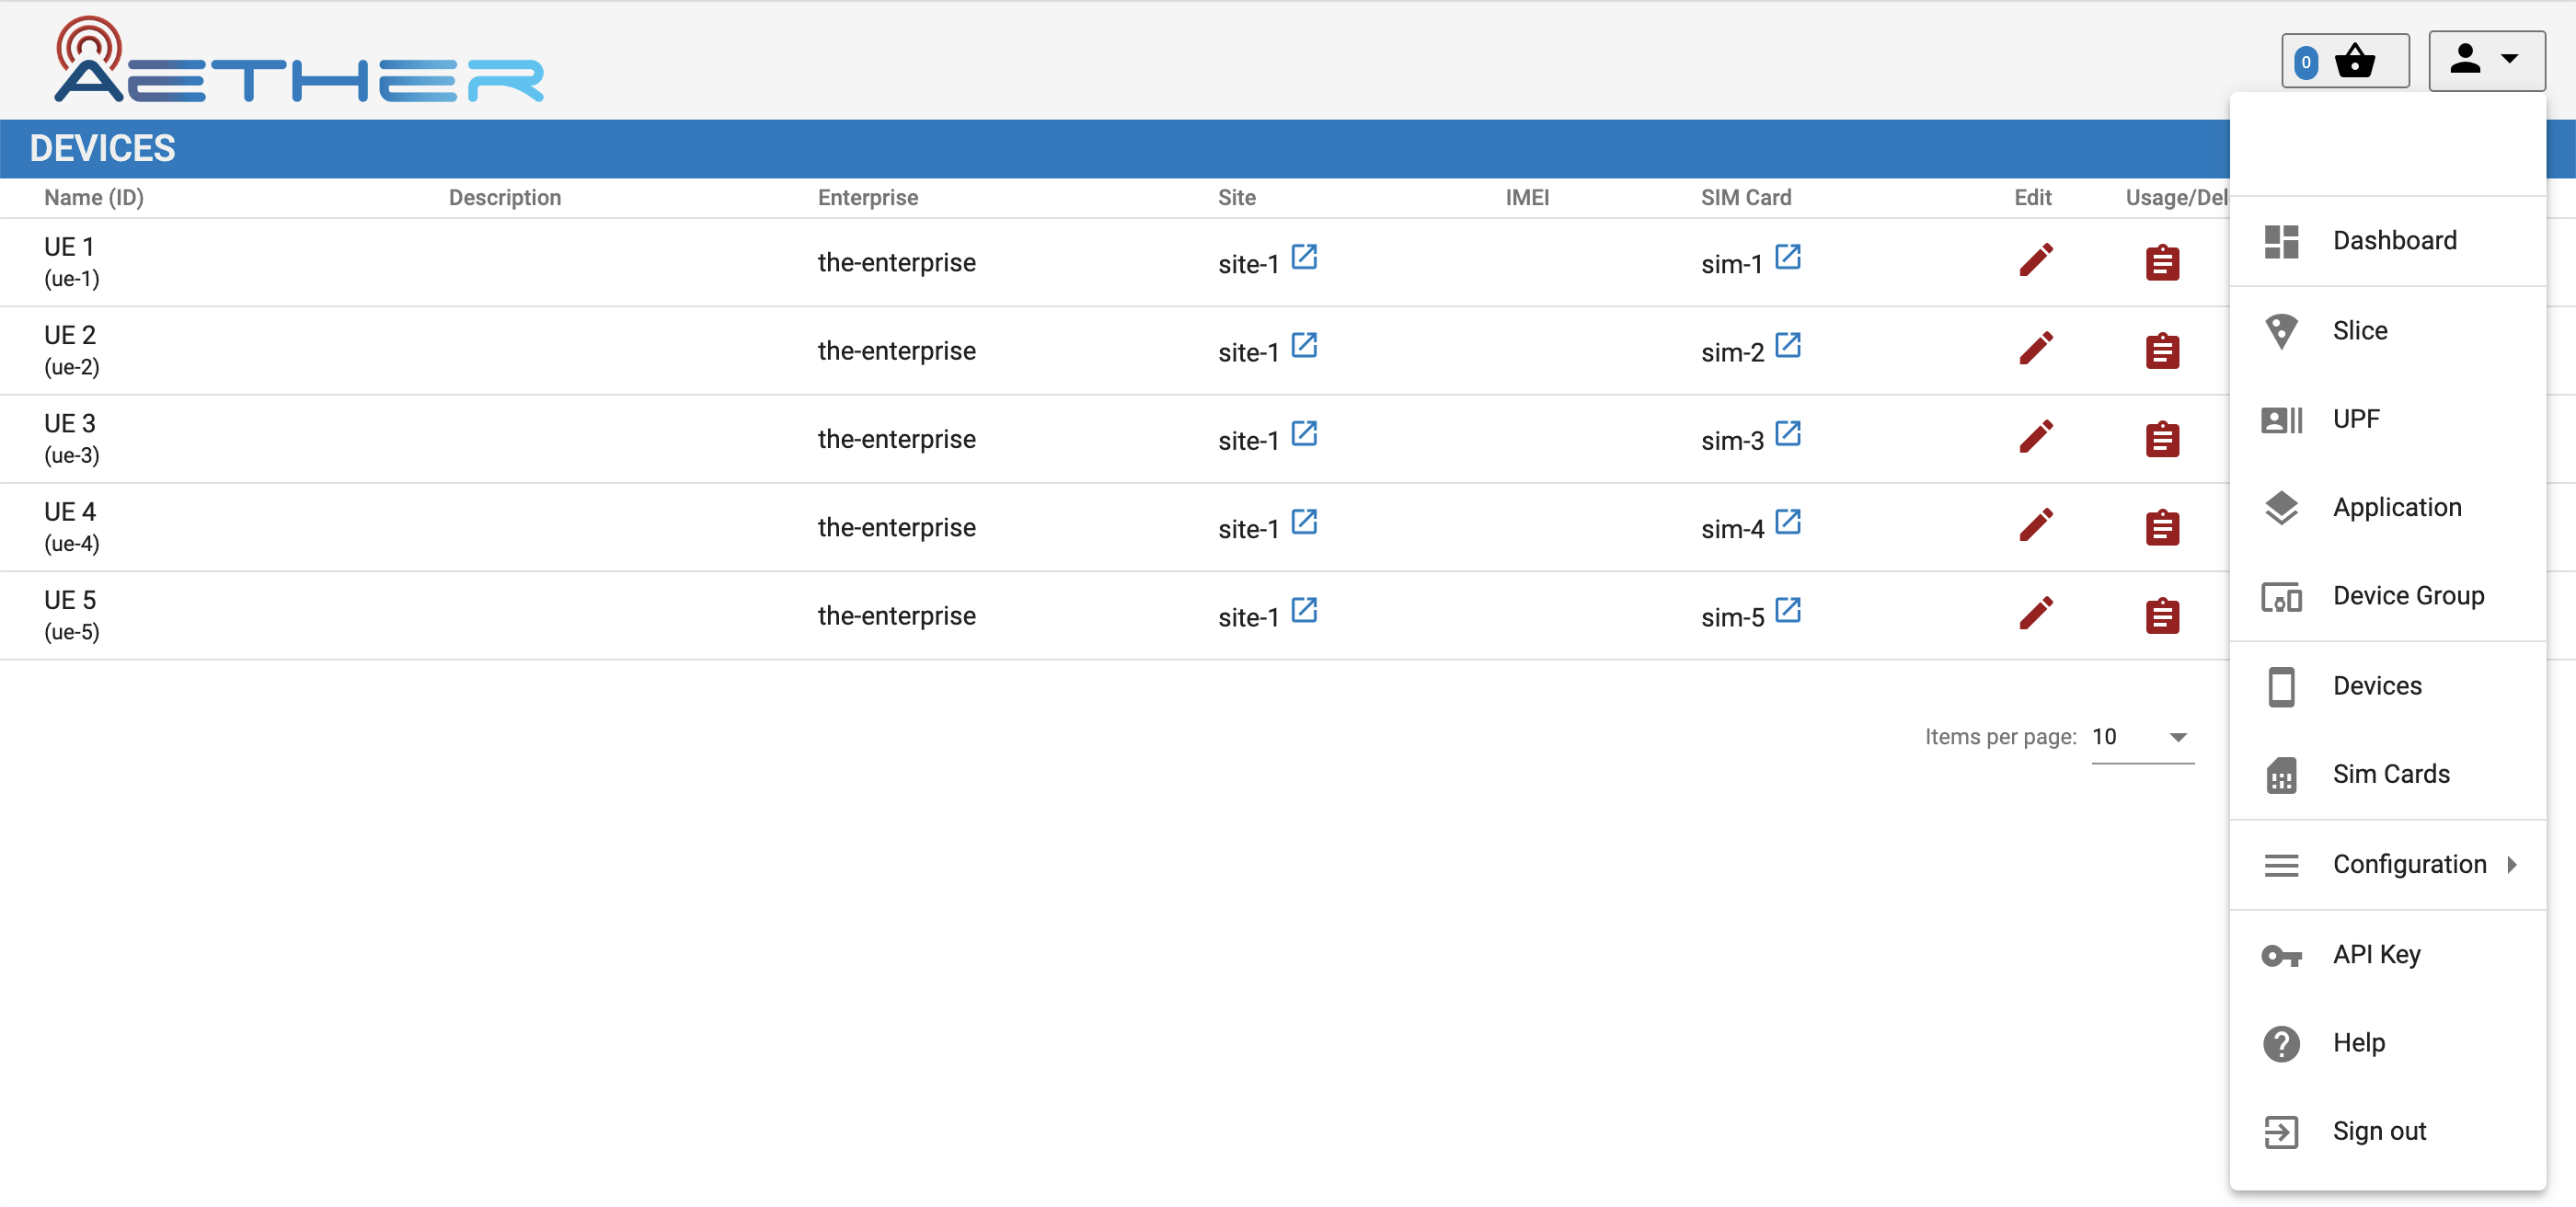
Figure 2. Screenshot of the ROC dashboard, showing known Devices. The dropdown menu on the right lists other available pages.
Turning to the Monitoring Dashboard, you will initially see Kubernetes-related performance stats. Select the 5G Dashboard option to display information reported by SD-Core. Similar to Figure 3, the page shows an active (green) UPF, and once you rerun the RAN simulator (gNBsim), some number of active base stations and connected devices. The bottom panel shows the UPF throughput, which due to gNBsim's focus on stressing the control plane, typically shows only minimal activity.
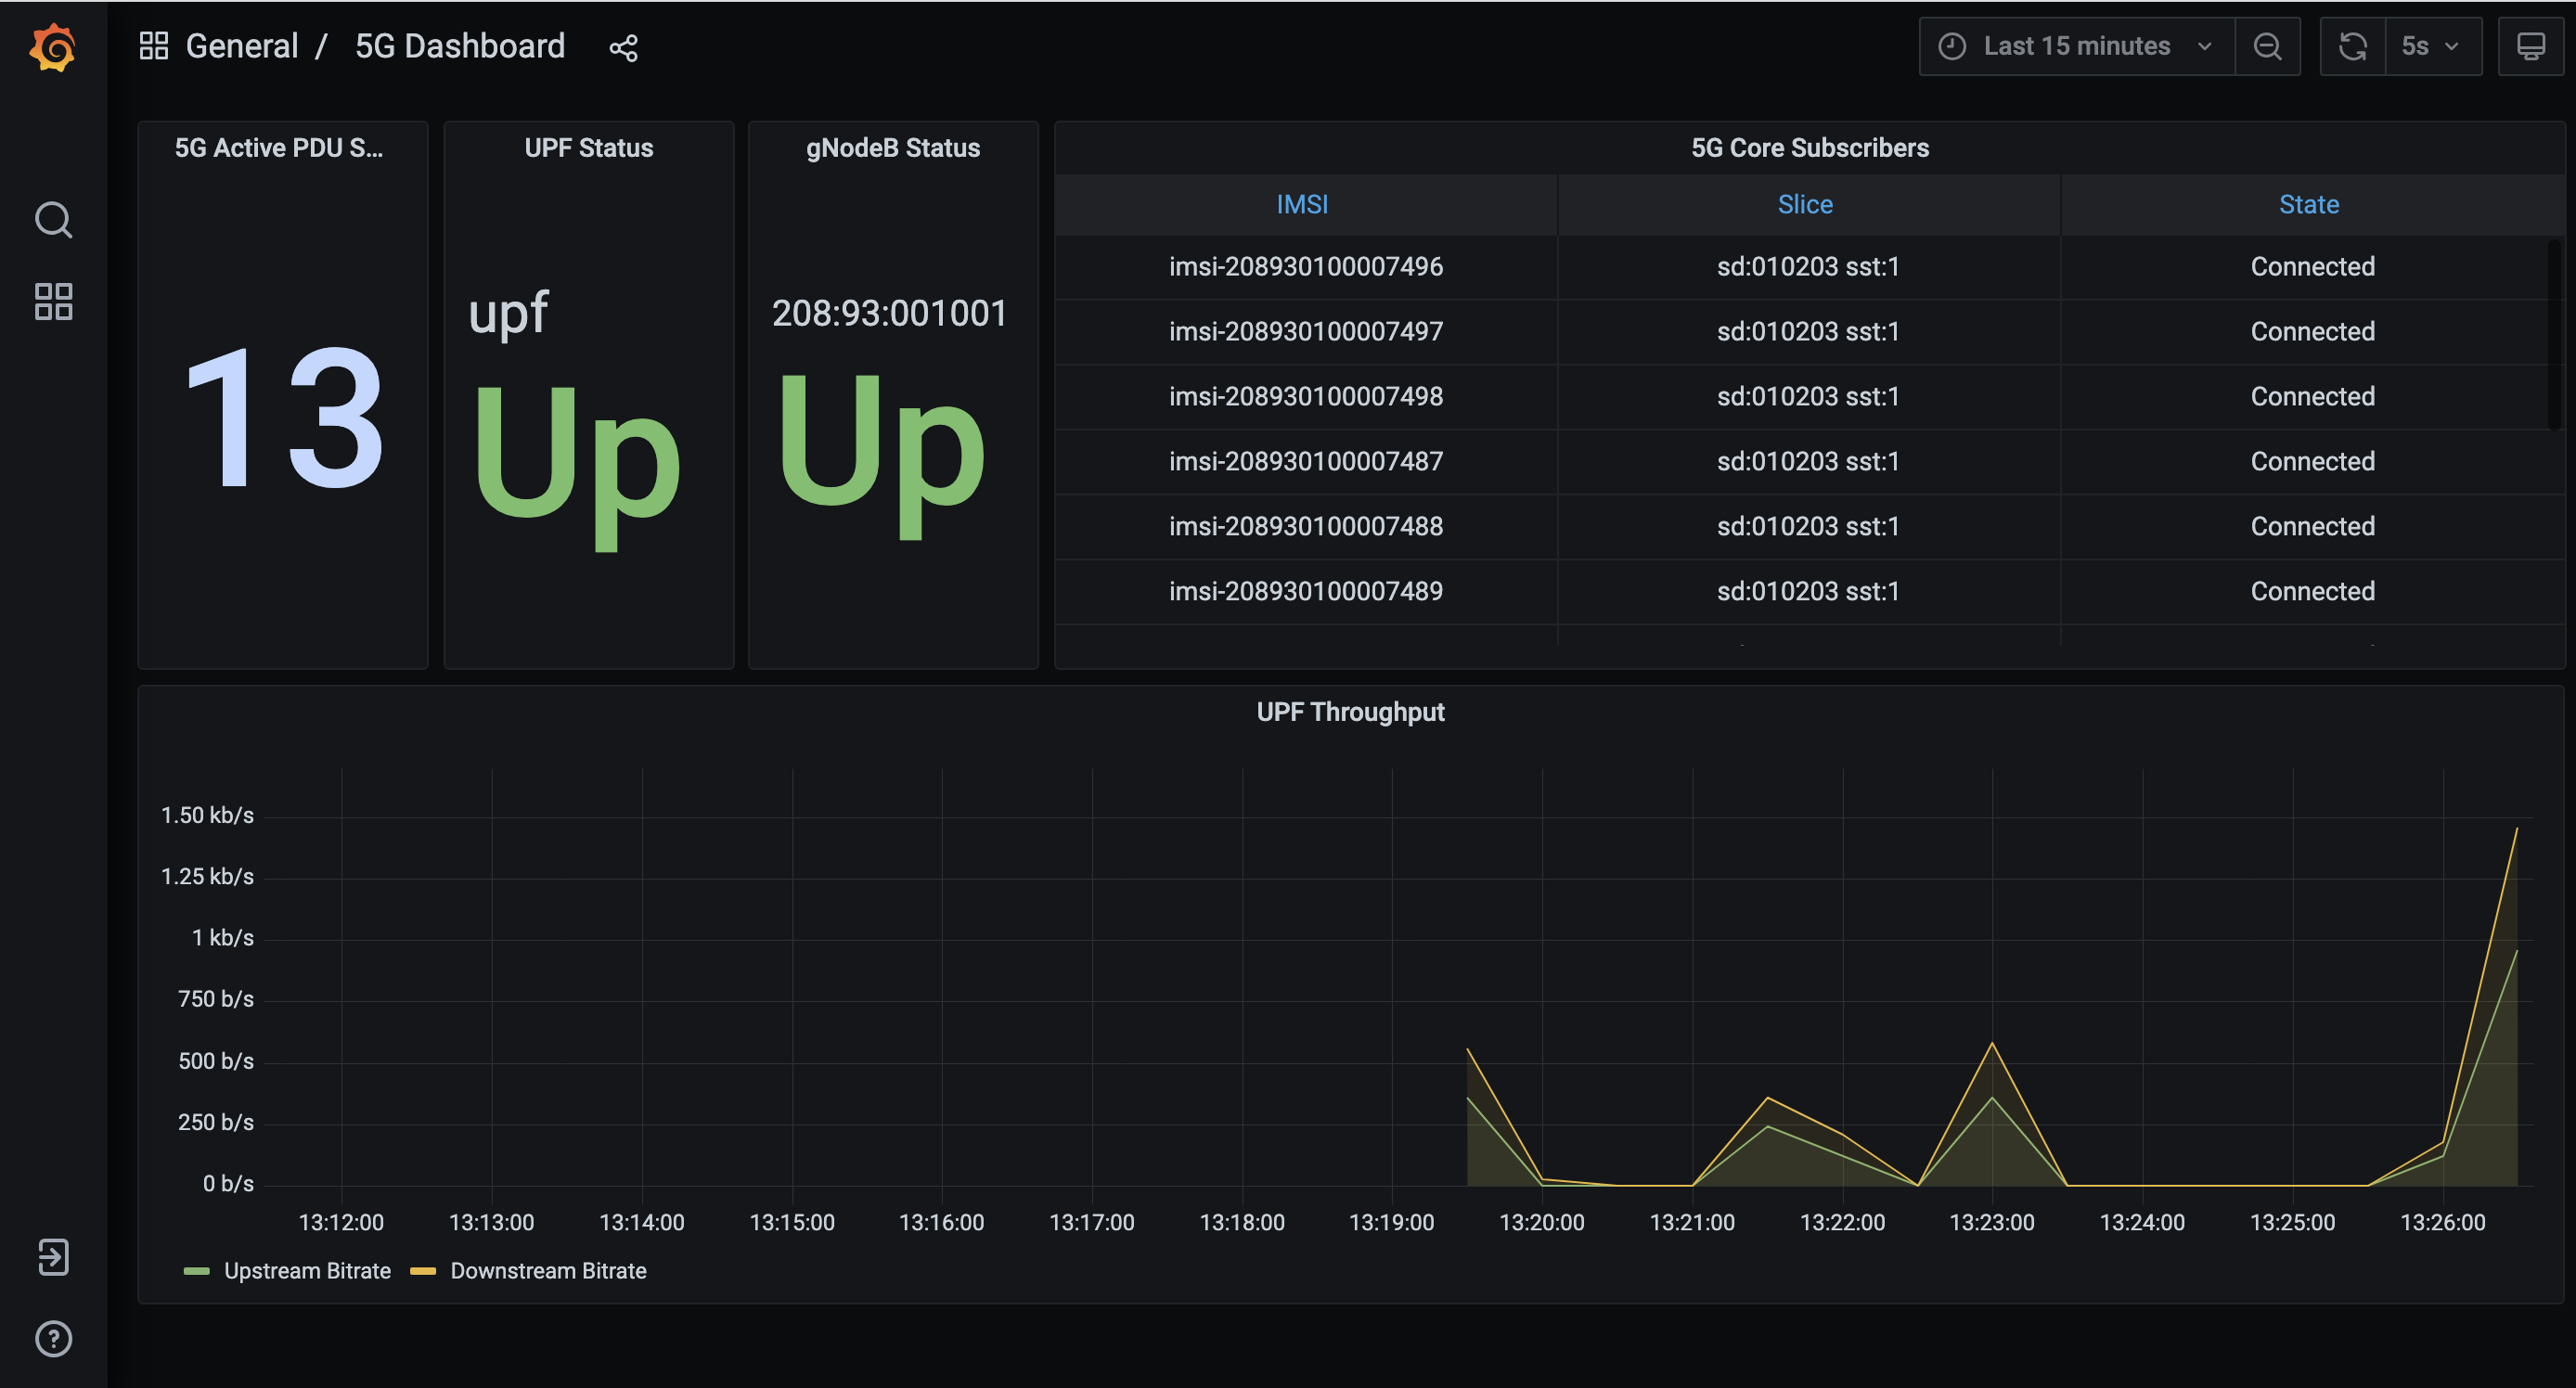
Figure 3. Screenshot of the monitoring subsystem's 5G dashboard.
When you are done experimenting with AMP, type the following to tear it down:
$ make aether-amp-uninstall
Finally, while we have been using a single Make target to install (uninstall) AMP as a whole, there are per-component targets for both ROC and Monitoring if you are interested in only one or the other. For ROC:
$ make roc-install
$ make roc-load
$  ...
$ make roc-uninstall
and for Monitoring:
$ make monitor-install
$ make monitor-load
$  ...
$ make monitor-uninstall
In both cases, installing the component is a two-step process: first
the microservices that implement the component are instantiated on
Kubernetes and then service-specific data is loaded into the running
containers. For ROC, that data populates the models that define the
API. For Monitoring, that data specifies the dashboard panels. In
general, there are per-component targets for all of the Aether-wide
(aether-*) targets; see the Makefile for details.
View Logs
You've already seen the log file generated by gNBsim for each
emulation run, but you can also inspect the logs generated by
individual microservices that implement Aether. Doing so is certainly
helpful when debugging a failure, but it can also be an aid in
learning how each microservice works. For example, the following
command outputs the log for the bessd container, one of five
containers running as part of the upf-0 pod:
$ kubectl logs -n aether-5gc -p upf-0 bessd
While kubectl works just fine for tasks like this, you may also
want to install k9s, a terminal-based UI
that provides a convenient alternative for interacting with Kubernetes.
Once installed, the following command brings up the UI for the
namespace that implements SD-Core.
$ k9s -n aether-5gc
Figure 4 shows an example k9s display, where you
can scroll up and down, and then invoke one of the listed
commands—such as <l> (display log) or <s> (open a shell)—for
the selected pod.
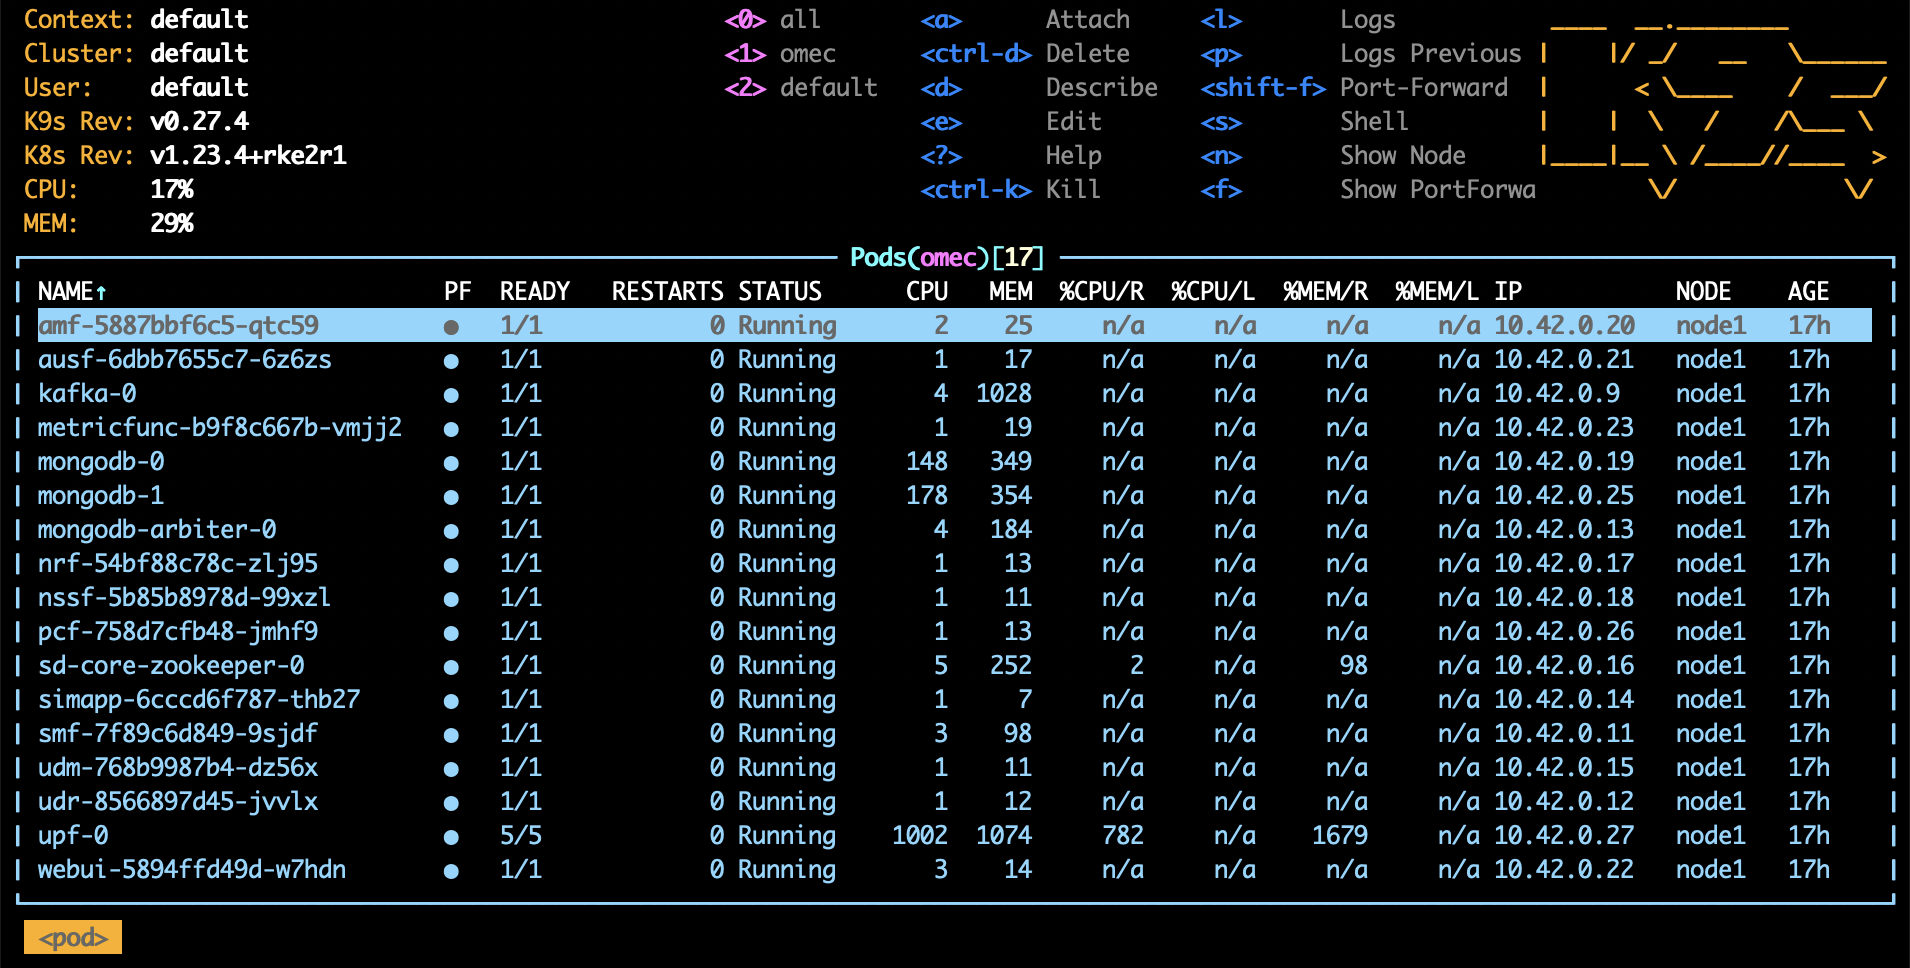
Figure 4. Screenshot of k9s's UI for the aether-5gc namespace, with the AMF pod
currently selected.
Run Ksniff and Wireshark
In addition to the trace output generated by the simulator, a good way to understand the inner working of Aether is to use Ksniff (a Kubernetes plugin) to capture packets and display their headers as they flow into and out of the microservices that implement Aether. Output from Ksniff can then be fed into Wireshark.
To install the Ksniff plugin on the server running Aether, you need to
first install krew, the Kubernetes plugin manager. Instructions on
doing that can be found online. Once
that's done, you can install Ksniff by typing:
$ kubectl krew install sniff
You can then run Ksniff in the context of a specific Kubernetes pod by specifying their namespace and instance names, and then redirecting the output to Wireshark. If you don't have a desktop environment on your Aether server, you can either view the output using a simpler packet analyzer, such as tshark, or by redirecting the PCAP output in a file and transfer it a desktop machine for viewing in Wireshark.
For example, the following captures and displays traffic into and out
of the AMF, where you need to substitute the name of the AMP pod
you learned from kubectl in place of amf-5887bbf6c5-pc9g2.
$ kubectl sniff -n aether-5gc amf-5887bbf6c5-pc9g2 -o - | tshark -r -
Of course, you'll also need to restart the RAN emulator to generate workload for this tool to capture.