Built-In Monitoring
Warning
This section documents monitoring built into the ROC web GUI. ROC is being archived and is no longer installed or supported by OnRamp. This page is retained for historical reference only.
This section documents features built-in to the GUI for monitoring.
Note
Although monitoring icons remain visible in the GUI, the integrated monitoring feature is not currently supported. Use the Prometheus/Grafana monitoring subsystem instead.
Monitoring a DeviceGroup
The performance of a Device Group can be monitored in many ways, by clicking its  (monitor) icon:
From the Slice Monitor page, which shows all DeviceGroup’s belonging to an Slice.
From the DeviceGroup List Page - click the
icon for the DeviceGroup.When editing an existing DeviceGroup - in the Edit page, the
is next to the id.
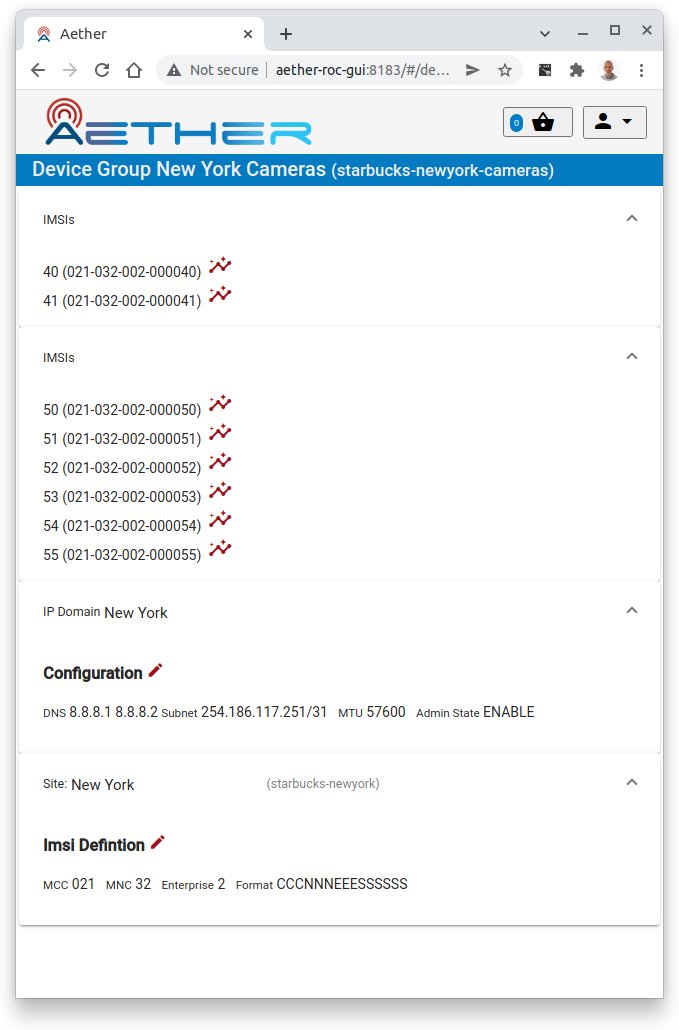
The monitor page itself shows:
An information Panel for each IMSI Range in the DeviceGroup
Each Device has a
button that allows further drill downEach Device is shown with its fully expanded IMSI number (a combination of IMSI ID and Site parameters)
An information panel for the Site and IP Domain of the DeviceGroup
Clicking on the down arrow expands each panel
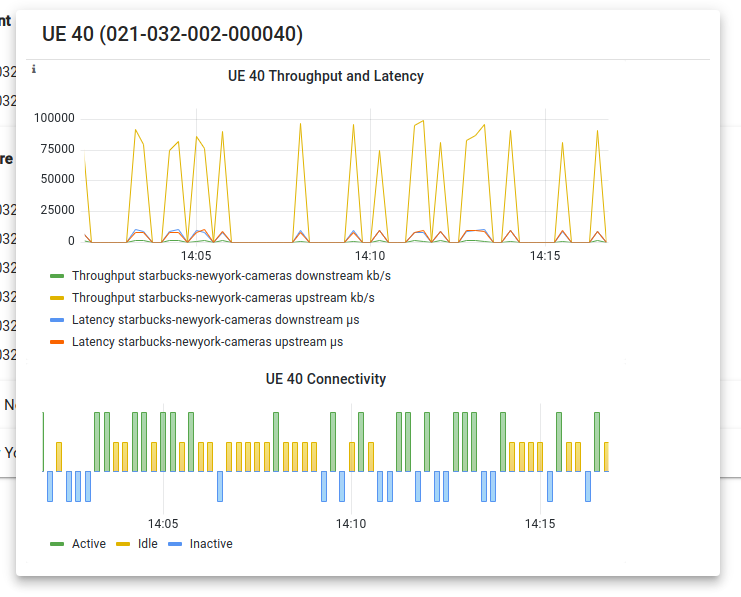
The per Device Monitor panel contains:
a graph of the Device’s Throughput and Latency over the last 15 minutes
a graph of the Device’s connectivity over the last 15 minutes
Monitoring a Slice
The performance of a Slice can be monitored in many ways, by clicking its (monitor) icon:
From the Dashboard page, which shows all Slice’s belonging to an Enterprise.
From the Slice List Page - click the
icon for the Slice.When editing an existing Slice - in the Edit page, the
is next to the id
The monitor page itself shows:
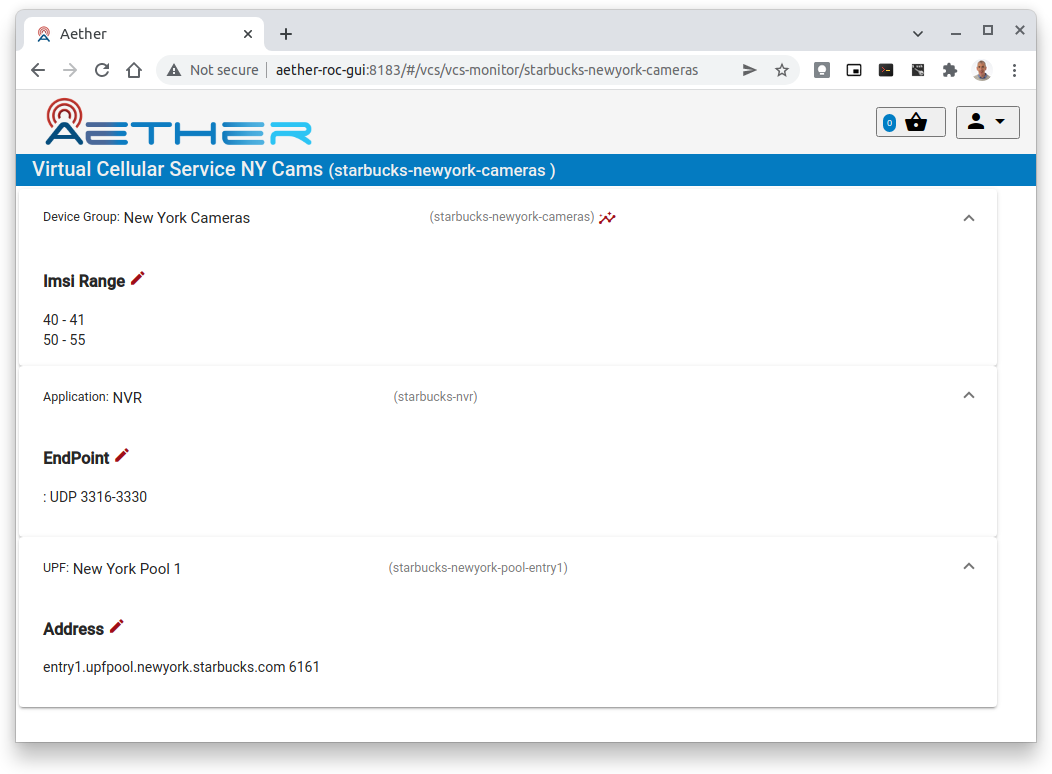
A link to the Monitoring page of each Device Group. See Monitoring a DeviceGroup.
Information panels for each sub-object of the Slice
Clicking on the down arrow expands each panel